Summary: Latitude vs. X
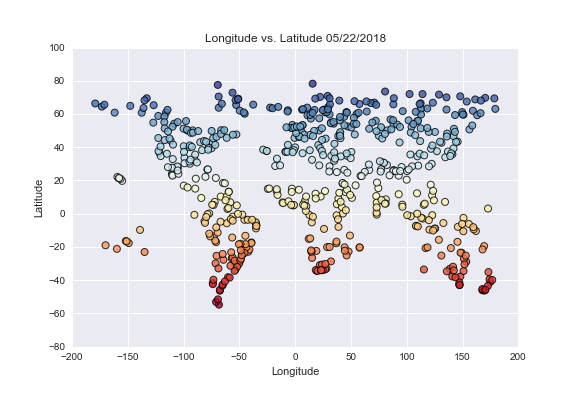
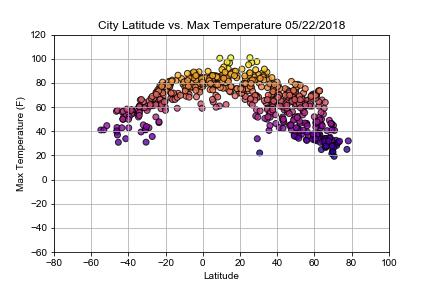
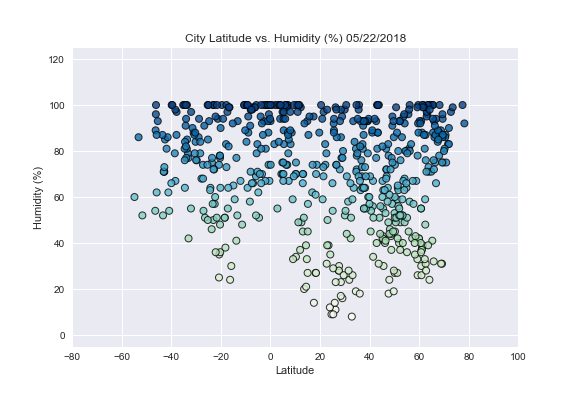
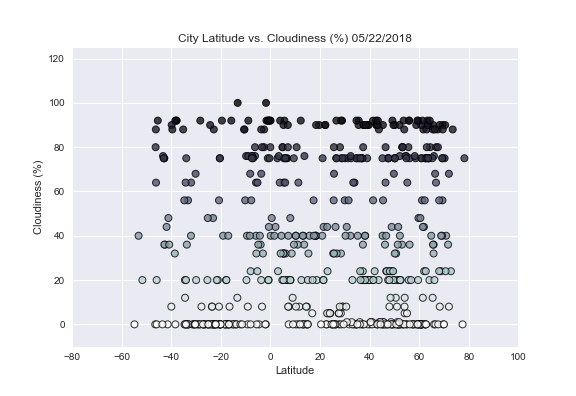
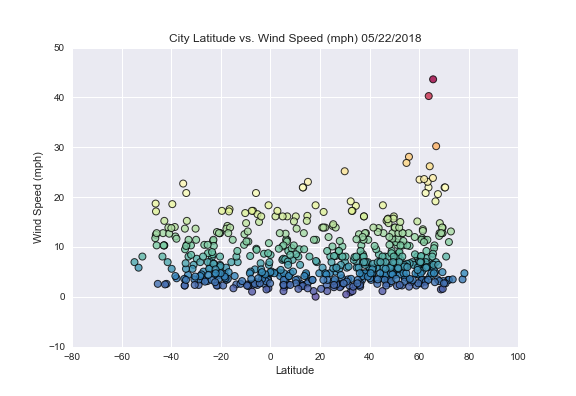
This is an analysis and visualization of weather of 500+ cities across the world. The main objective was to showcase the relationship of various factors like temperature, humidity, cloudiness and wind speed with respect to the distance from the equator.
For this analysis, coordinate pairs of latitude and longitude were created randomly and then citypy (a python library) was used to generate city names for respective coordinates.
After selecting unique non-repeat observations, a weather check was performed on each of the cities using a series of successive API calls from OpenWeatherMap. Then all different point of interests were plotted against latitude using Matplotlib and Seaborn libraries.
Visualizations